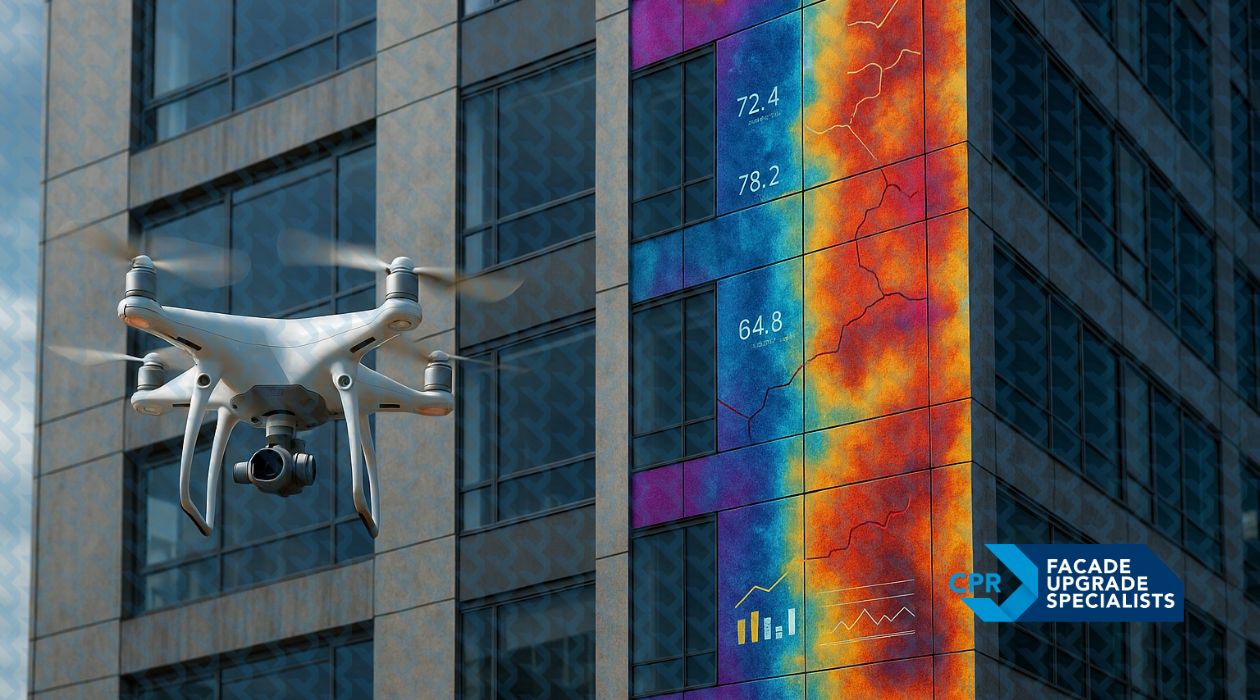
Quantified defect mapping isn’t marketing fluff; it’s the difference between “she’ll be right” and she’s structurally sound. CPR’s drone‑mounted LiDAR, 48 MP imaging and rope‑access sensors convert casual façade condition surveys into forensic, number‑rich dossiers that steer precise remediation and save Australian asset owners millions.
Stakeholders—from insurers and financiers to strata committees—now demand hard numbers. They need to know how many cracked panels, how deep that concrete spall runs and exactly where water is creeping in. A vague line in an inspection report no longer passes muster when you’re signing off a seven‑figure maintenance budget.
Quantified Defect Mapping, Plain and Simple
One Toolkit, Three Jobs
By folding 48 MP drones, rope‑access borescopes and LiDAR‑enabled FIMS scanners into one capture sweep, CPR collects every blemish, void and variance—ready for PEARS® analytics to flag risk and cost within hours.
Four‑Step Workflow
- Capture – High‑resolution aerial and close‑quarter data in a single pass.
- Crunch – PEARS® benchmarks new defects against historic BIM and Australian Standards.
- Colour‑code – Traffic‑light overlays give board‑level clarity at a glance.
- Communicate – SFS360® dashboards push live tasks straight to your FM software.
Deliverables You Can Use
Layered PDF maps, interactive 3D twins and raw CSV packs drop directly into Archibus, Planon or a plain spreadsheet—no re‑keying, no proprietary lock‑in.
Why Ground‑Level Glances Don’t Cut It
Visual Inspection vs Quantified Mapping
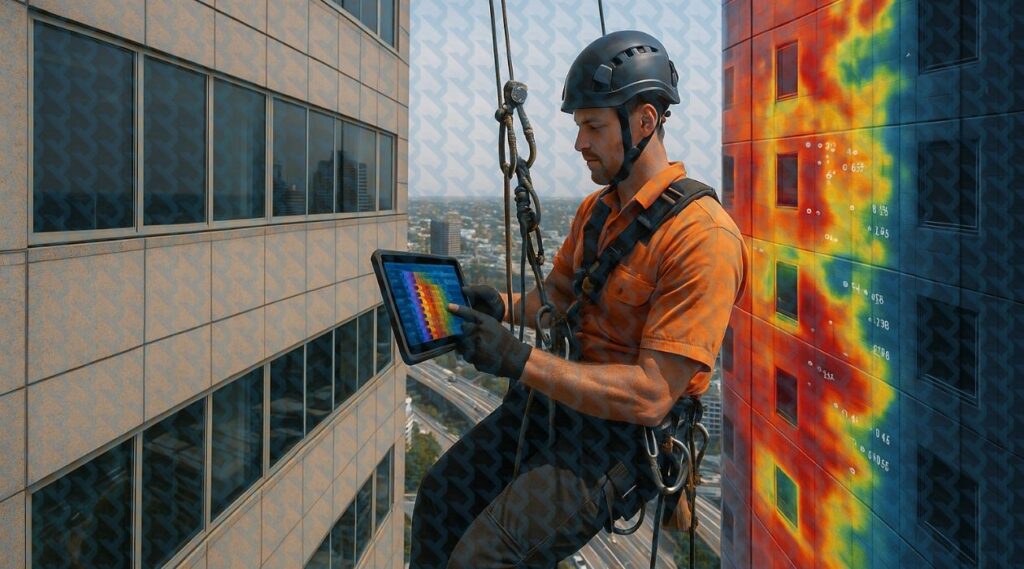
A clipboard walk‑around catches flaking paint but skips moisture pockets, hidden delamination and hairline fractures. High‑resolution drone imagery and infrared reveal what the naked eye ignores.
The Hidden Cost of Missed Defects
Every undetected cavity inflates remediation outlay by up to five‑fold once water spreads. Our data‑driven maintenancetags early‑stage issues so you invest in prevention, not crisis scaffolds.
Risk, Regulation and Reputation
Since the NSW Design & Building Practitioners Act kicked in, duty‑holders must prove façade safety throughout a building’s life. Ground checks fail that audit, leaving directors exposed.
Transparency You Can Audit
Objective Evaluations, Not Opinions
Geo‑referenced, time‑stamped imagery and raw CSV allow independent engineers to audit every finding—no subjective “looks fine” notes.
Ready‑Made Compliance Packs
Life‑Cycle Cost Certainty
Quantified histories let us forecast whole‑of‑life spend and show owners a ten‑year cash‑flow curve—so finance teams aren’t flying blind.
From Data to Action: CPR’s End‑to‑End Advantage
Survey‑to‑Design Continuity
Because CPR handles inspection and engineering, no data is lost in translation. Designers work off the same point cloud you saw on‑site.
Cost & Programme Certainty
Data kills guesswork. Clients routinely save 20–30 % on remediation budgets and shave weeks off programmes.
| Project | Mapping Hours | Saving vs Scaffold Survey | Outcome |
| Harbourview Tower, Sydney | 16 | $180 k | Targeted anchor retrofit only where tensile tests flagged weakness |
| Riverfront Apts, Brisbane | 12 | $95 k | Re‑sealed 11 % of joints instead of a full elevation reseal |
| Civic Chambers, Melbourne | 18 | $210 k | Switched from cladding strip‑out to patch remediation |
Asset Value & Sustainability
Quantified defect histories lift resale value and cut embodied carbon via pinpoint repairs.
Your Top Three Questions—Answered
Is drone data safe in built‑up areas?
Yes. CASA‑licenced pilots fly within ReOC guidelines, and all footage is end‑to‑end encrypted.
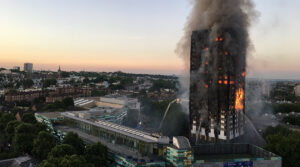
Can the system detect fire‑risk cladding?
Thermal signatures and density metrics flag suspect ACM, ready for lab confirmation.
How long does a 30‑storey scan take?
Typically one to two shifts—no scaffold, minimal tenant disruption.
Ready to See the Whole Picture?
Stop guessing; start quantifying. Book a data‑driven façade inspection and get a sample SFS360® dashboard today.
🔗 Consultancy & Inspection
🔗 Defects Assessment Scope & Report
🔗 Regulated Design Compliance